Value Investment
Forecasting period = n years, afterwards apply the Gordon Growth Model. The value is determined by:
- Cash flows are uncertain: they can be positive or negative, large or small.
- If the company bankrupts, the cash flows are 0's forever.
- Real option(故事): the value of a future cash flow depends on the outcome of the future event. If the future cash flow jumps up, the real option worths a lot. 实物期权反映的是未来不确定机会所带来的潜在价值
- Simulation: distribution of future cash flows
- Expectations embedded in price of a stock and how the expectations change
- The forecasting period, n, depends on how far you can forecast into the future: Forecast Horizon. When developing their discounted cash flow (DCF) models, analysts tend to use
forecast horizons of 5 or 10 years, although both are arbitrary. To better reflect financial reality, I recommend that analysts think more about the life cycles of companies
and the amount of time it takes for returns on capital to revert back to the cost of capital. To reflect this view, I use a model based on the competitive advantage period (CAP),
or the period of time during which a company can generate excess returns on its new investments. CAPs differ from company to company and particularly among types of companies,
but a powerful force that affects CAPs is reversion to the mean, which has been substantiated in dozens of empirical studies.
- The discount rate depends on the degree of uncertainty in the cash flows
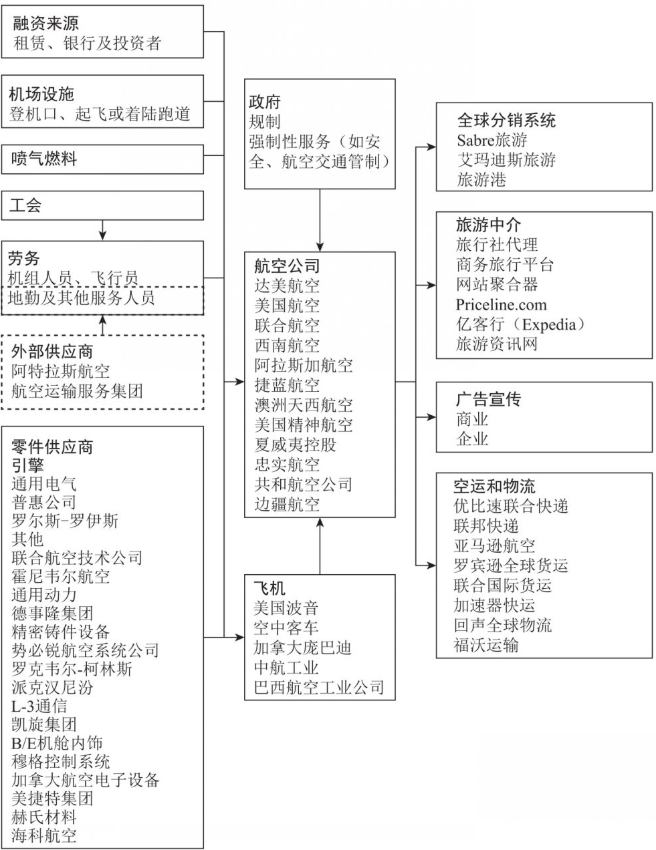
- Competitive advantage: industry map
- 你的估值得到的最直接的反馈是其他人当前给这家公司的定价
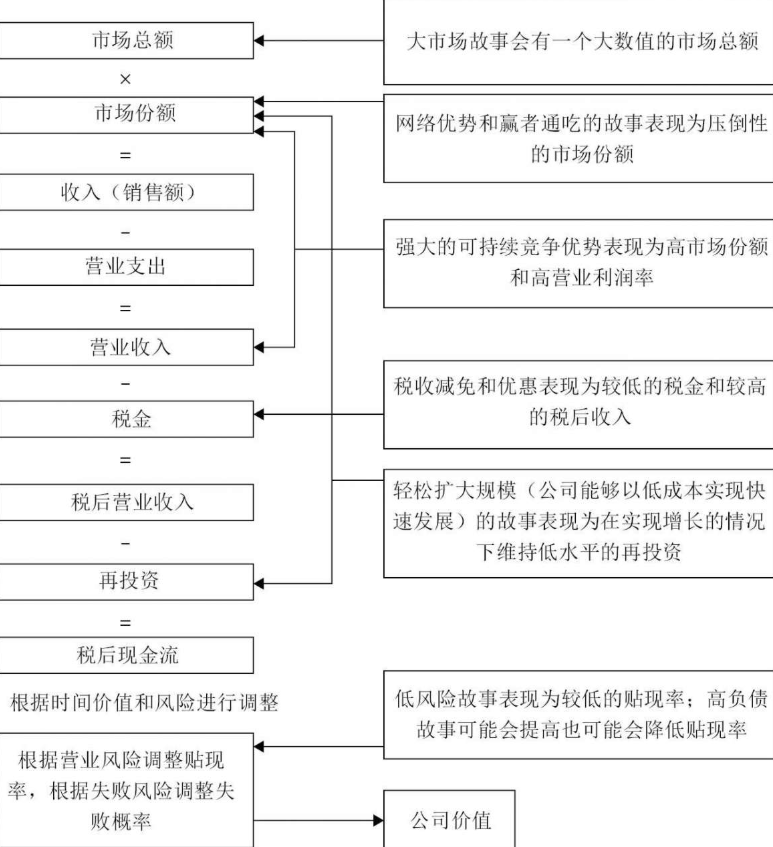
- 你不能仅仅使用方程式和数字模型来衡量一个容易发生变化的公司,你还需要一个故事;当数字不断变化时,你可以回到故事上。
- 商业智谋浅者,直接接受损益表中的获利数字;商业智谋深者,反复检讨质疑资产负债表中的资产是否被高估、负债是否被低估
- 竞争永远是动态的,因此,了解行业的进入和退出模式至关重要。评估潜在威胁的起点,就是对进入和退出行业的现实状态进行分析。新兴行业的进入和退出频率总体上高于传统行业,但经验告诉我们,进出所有行业的活跃性都远超过公司高管或投资者的想象。
- 区分企业是正在建立竞争优势还是浪费资金的最好方法,是监控企业所服务的客户数量
- 通过某种方式,知道独家信息,这是投资唯一合理的依据
Key task: forecast cash flows
Cash flows depends on:
- Life cycle: different indicators at different stages
- Macroeconomic factors
- Risks: inventory depletion, account receivables default
- Debt
- Cash
- 交叉持股
- 股权激励
expectations investing
real options
Fundamental Analysis
- Valuation is counting cash, not hopes or dreams.
- Business Model
- fundamental analysis: intrinsic value
- technical analysis: trend personality
- stragegy
- methodology
- data
- validation
Value: Discounted Cash Flow Model
现金流折现公式形式上虽然是精确的数学公式,但在实际使用中,我们无法精确地预测未来现金流和折现率,所以应该将其作为一种定性的方法。
一个精确的数学公式,却成为一种定性的方法,这让很多人无法理解。其实背后的含义是,现金流折现公式精确计算的结果并不重要,但计算过程所揭示的原理却十分重要。
它是我们分析企业价值的重要指引。
Assuming we have perfect foresight, the value is determined by:
Where FCFFi is the free cash flow to the firm in period i, and ri is the discount rate in period i.
FCCR = EBIT*(1-Tax Rate) + Depreciation & Amortization - Capital Expenditures - changes in net working capital
Equity Value = Enterprise Value - Total Debt + Cash & Cash Equivalents
Common Equity Value = Equity Value - Minority Interest - Preferred Equity
Since it is not possible to forecast all the periods in the future, we need to determine a forecasting period and make assumptions for periods afterward:
-
Forecasting period = 5 years, afterwards apply the Gordon Growth Model. The value is determined by:
-
Forecasting period = 1 year, assuming no growth (g = 0) and constant discount rate r. The value is determined by
Infinite Geometric Series:
-
Using earnings instead of cash flow, we have:
- For CRE, we have:
-
Using market price, rearrange:
PE multiple has its root in the Discounted Cash Flow model. Therefore, in theory, it can be used to determine the absolute intrinsic value.
股价是如何决定的呢?一个恒等式可以解释:P = EPS × PE,股价 = 每股盈利 × 市盈率。这个公式,揭示了投资者应该修炼的能力,EPS是商业判断力,PE则代表洞察人性的能力。
每股盈利代表企业的经营状况,是以年计、变化缓慢的;市盈率代表的估值水平至少是以分钟、以秒计的。股价的每次变化,都代表PE发生了变化。
In practice, we start with the simplest form, then try to relax the assumptions step by step.
Other multiples can only indicate the relative values of different companies.
The discount rate (r), or the required return, can be expressed as:
Valuation involves two fundamental tasks:
-
Forecast the distribution of cash flows in every period.
-
Determine the risk premiums in every period:
- Risk is defined as the probability that the actual cash flows are less than the forecasted cash flows (e.g., 20th percentile).
- Another measure of risk is the volatility or standard deviation of the forecasted cash flow distribution.
To account for higher risks, we can either decrease the estimates for cash flows (CF) or increase the risk premiums.
Best Practices for Projecting Cash Flows
Projecting cash flows is a critical component of financial analysis and valuation. It requires a careful blend of historical analysis, understanding of the company's business model, and consideration of external factors. Below are some of the best practices for projecting cash flows:
-
Historical Financial Analysis: Start by analyzing the company's historical financial statements. Look at the past few years of income statements, balance sheets, and cash flow statements to understand trends in revenue, expenses, working capital needs, and cash flow patterns.
-
Understanding the Business Model: Develop a deep understanding of the company's business model. This includes knowledge about the company's products or services, market position, competitive landscape, customer base, revenue streams, cost structure, and unique factors impacting future performance.
-
Revenue Projections: Forecast future revenues by considering factors like market growth, market share, pricing strategies, new product launches, expansion plans, and industry trends. Use methods such as bottom-up forecasting, top-down forecasting, or trend analysis.
-
Expense Forecasting: Estimate future expenses, including cost of goods sold (COGS), operating expenses, and capital expenditures. Factor in historical trends, expected changes in cost structure, economies of scale, and planned investments or cost-saving initiatives.
-
Working Capital Management: Evaluate changes in working capital components like inventory, accounts receivable, and accounts payable.
Consider how these might shift with revenue growth or contraction, which is critical for managing bankruptcy risk.
-
Consideration of External Factors: Include external influences like economic conditions, regulatory changes, technological advancements, and competitive dynamics, as these can significantly impact the company's performance.
-
Scenario Analysis: Conduct scenario analysis to account for different potential futures. Typically, this includes a base case, an optimistic case, and a pessimistic case, each with varying assumptions about key drivers like sales growth, margins, and capital expenditure.
-
Sensitivity Analysis: Perform sensitivity analysis to understand how changes in key assumptions affect cash flows. This helps identify which variables have the most significant impact on projections.
-
Management Guidance and Industry Benchmarks: Incorporate management's future guidance if available and compare projections against industry standards and competitors.
-
Regular Reviews and Updates: Regularly review and update projections as new information becomes available. Updates can occur quarterly, semi-annually, or annually.
Remember, projecting cash flows is as much an art as it is a science. It requires a balance between quantitative analysis and qualitative judgment. Given the inherent uncertainties in forecasting, it's essential to monitor actual performance against projections continuously and adjust assumptions accordingly.
Choosing the Appropriate Discount Rate
Choosing the appropriate discount rate is a critical step in financial analysis, especially for investment valuation and capital budgeting. The discount rate reflects the opportunity cost of capital, considering the risk of the investment. Below are key factors and methods to consider when selecting a discount rate:
-
Cost of Capital: The most commonly used discount rate is the company's cost of capital. This reflects the return required by (other) investors given the risk of investing in the company.
-
Weighted Average Cost of Capital (WACC): WACC is a popular method for estimating the cost of capital. It’s a weighted average of the costs of debt and equity, reflecting the relative proportions of debt and equity financing used by the company. WACC accounts for the after-tax cost of debt and the cost of equity (calculated using models like the Capital Asset Pricing Model or CAPM).
-
Industry-Specific Rate: Consider the average cost of capital for the industry in which the company operates. Different industries have varying risk profiles, which should be reflected in the discount rate.
-
Risk-Free Rate: The risk-free rate is typically based on government bond yields, such as U.S. Treasury rates. This rate serves as a baseline, to which additional risk premiums are added based on the investment’s risk level.
-
Risk Premiums: Add risk premiums to account for the specific risks associated with the investment. For example, in CAPM, the equity risk premium is added to the risk-free rate, multiplied by the company’s beta (a measure of volatility relative to the market).
-
Company's Risk Profile: Adjust the discount rate based on the company’s specific risk profile. Factors like financial stability, credit rating, operating history, market position, and management expertise can influence this assessment.
-
Project-Specific Risks: If evaluating a specific project rather than a company as a whole, consider risks unique to the project, such as execution risk, regulatory risk, and market acceptance.
-
Economic and Market Conditions: The broader economic environment, including interest rate trends, inflation expectations, and market volatility, can impact the appropriate discount rate.
-
Comparative Analysis: Compare discount rates used in similar investment valuations or transactions in the industry to ensure alignment with market standards.
-
Sensitivity Analysis: Conduct sensitivity analysis using different discount rates to understand how changes in the discount rate affect the valuation or investment decision.
It's important to note that the selection of a discount rate involves judgment and depends on the specific context of the analysis. The chosen rate should reflect both the time value of money and the risks associated with the investment or project. Regularly reviewing and adjusting the discount rate as conditions change is also crucial.
Determining Stock Overvaluation: Warren Buffett's Approach
Determining whether a stock is overvalued is a key component of Warren Buffett's investment strategy. Buffett uses several methods to assess if a stock is priced higher than its intrinsic value, which he defines as the present value of all future cash flows a company is expected to generate. Here are the main aspects he considers:
-
Price-to-Earnings (P/E) Ratio: This fundamental metric compares a company's current share price to its per-share earnings. A very high P/E ratio compared to industry averages or the company's historical P/E can indicate overvaluation.
-
Discounted Cash Flow (DCF) Analysis: Buffett often uses DCF analysis to estimate a company's intrinsic value. This method forecasts the company's free cash flows and discounts them to their present value using an appropriate discount rate. If the stock’s market price significantly exceeds this calculated intrinsic value, it may be overvalued.
-
Comparison to Historical Valuations: Buffett compares current valuation metrics (such as P/E, Price-to-Book, and Price-to-Sales ratios) with historical averages. A significant premium to these norms may signal overvaluation.
-
Margin of Safety: Emphasized by Benjamin Graham, this concept is crucial in Buffett's approach. He seeks a substantial buffer between the company’s intrinsic value and its market price to protect against potential losses due to overestimating intrinsic value or changing market conditions.
-
Industry Peer Comparison: Buffett compares a company's valuation metrics with its industry peers. A stock priced significantly higher than its peers without a clear rationale could indicate overvaluation.
-
Return on Equity (ROE) and Return on Invested Capital (ROIC): Buffett examines these metrics to evaluate how efficiently a company generates profits from shareholders' equity and overall invested capital. A stock might be overvalued if these metrics are deteriorating or lower than industry averages.
-
Economic Moat and Future Earnings Potential: Buffett evaluates a company's competitive advantage or 'moat' to determine whether its current valuation is justified. He considers the company's ability to sustain and grow earnings over time.
-
Market Trends and Speculation: Buffett avoids stocks that have risen sharply in price due to market trends or speculation rather than strong fundamentals. He is cautious of companies whose stock prices are driven by unsustainable factors.
Buffett's approach to evaluating overvaluation is comprehensive, combining quantitative metrics and qualitative assessments. He emphasizes understanding the business, its value, and market dynamics rather than relying solely on market trends or short-term financial metrics.
Company Analysis Process
- 商业模式 Business Model: 如何赚钱;盈利增长;六种类型;
- 竞争优势 Competitive Advantage: 产品是否符合标准 compliance, 是否有毒有害; 行业特点;生命周期;独家经营权
- 财务安全 Financial Strength: Predict and avoid bankruptcies;whether there is fraud
- 风险 Risks: 潜在负面因素
- 管理 Management: 报酬、性格和运作
- 估值 Valuation: Margin of safety;隐蔽资产
- 市场状况 Market: 货币 + 心理